Within P Doom
What the Average p(doom) Number Hides
A low median can coexist with a much higher mean when a minority of respondents assign very large probabilities to catastrophe.
On this page
- Reading medians without inventing consensus
- How high estimates pull up the mean
- Better ways to show disagreement and uncertainty
Page outline Jump by section
Introduction
When people discuss expert estimates of p(doom)—the probability that advanced AI causes human extinction or another irreversible civilisational catastrophe—they often focus on a single headline number. That can be misleading. A survey may report a median p(doom) of 5% while also reporting a mean of 16%. Those figures are not contradictory. They describe different aspects of the same distribution of opinions.

The distinction matters because p(doom) estimates are not clustered around one widely accepted value. Instead, they are highly uneven. Many respondents give relatively low probabilities, while a smaller group assigns much higher ones. As a result, the median can suggest modest concern even as the mean reflects the influence of a substantial minority with much more pessimistic views. Understanding both statistics gives a clearer picture of expert disagreement than either number alone.
Reading medians without inventing consensus
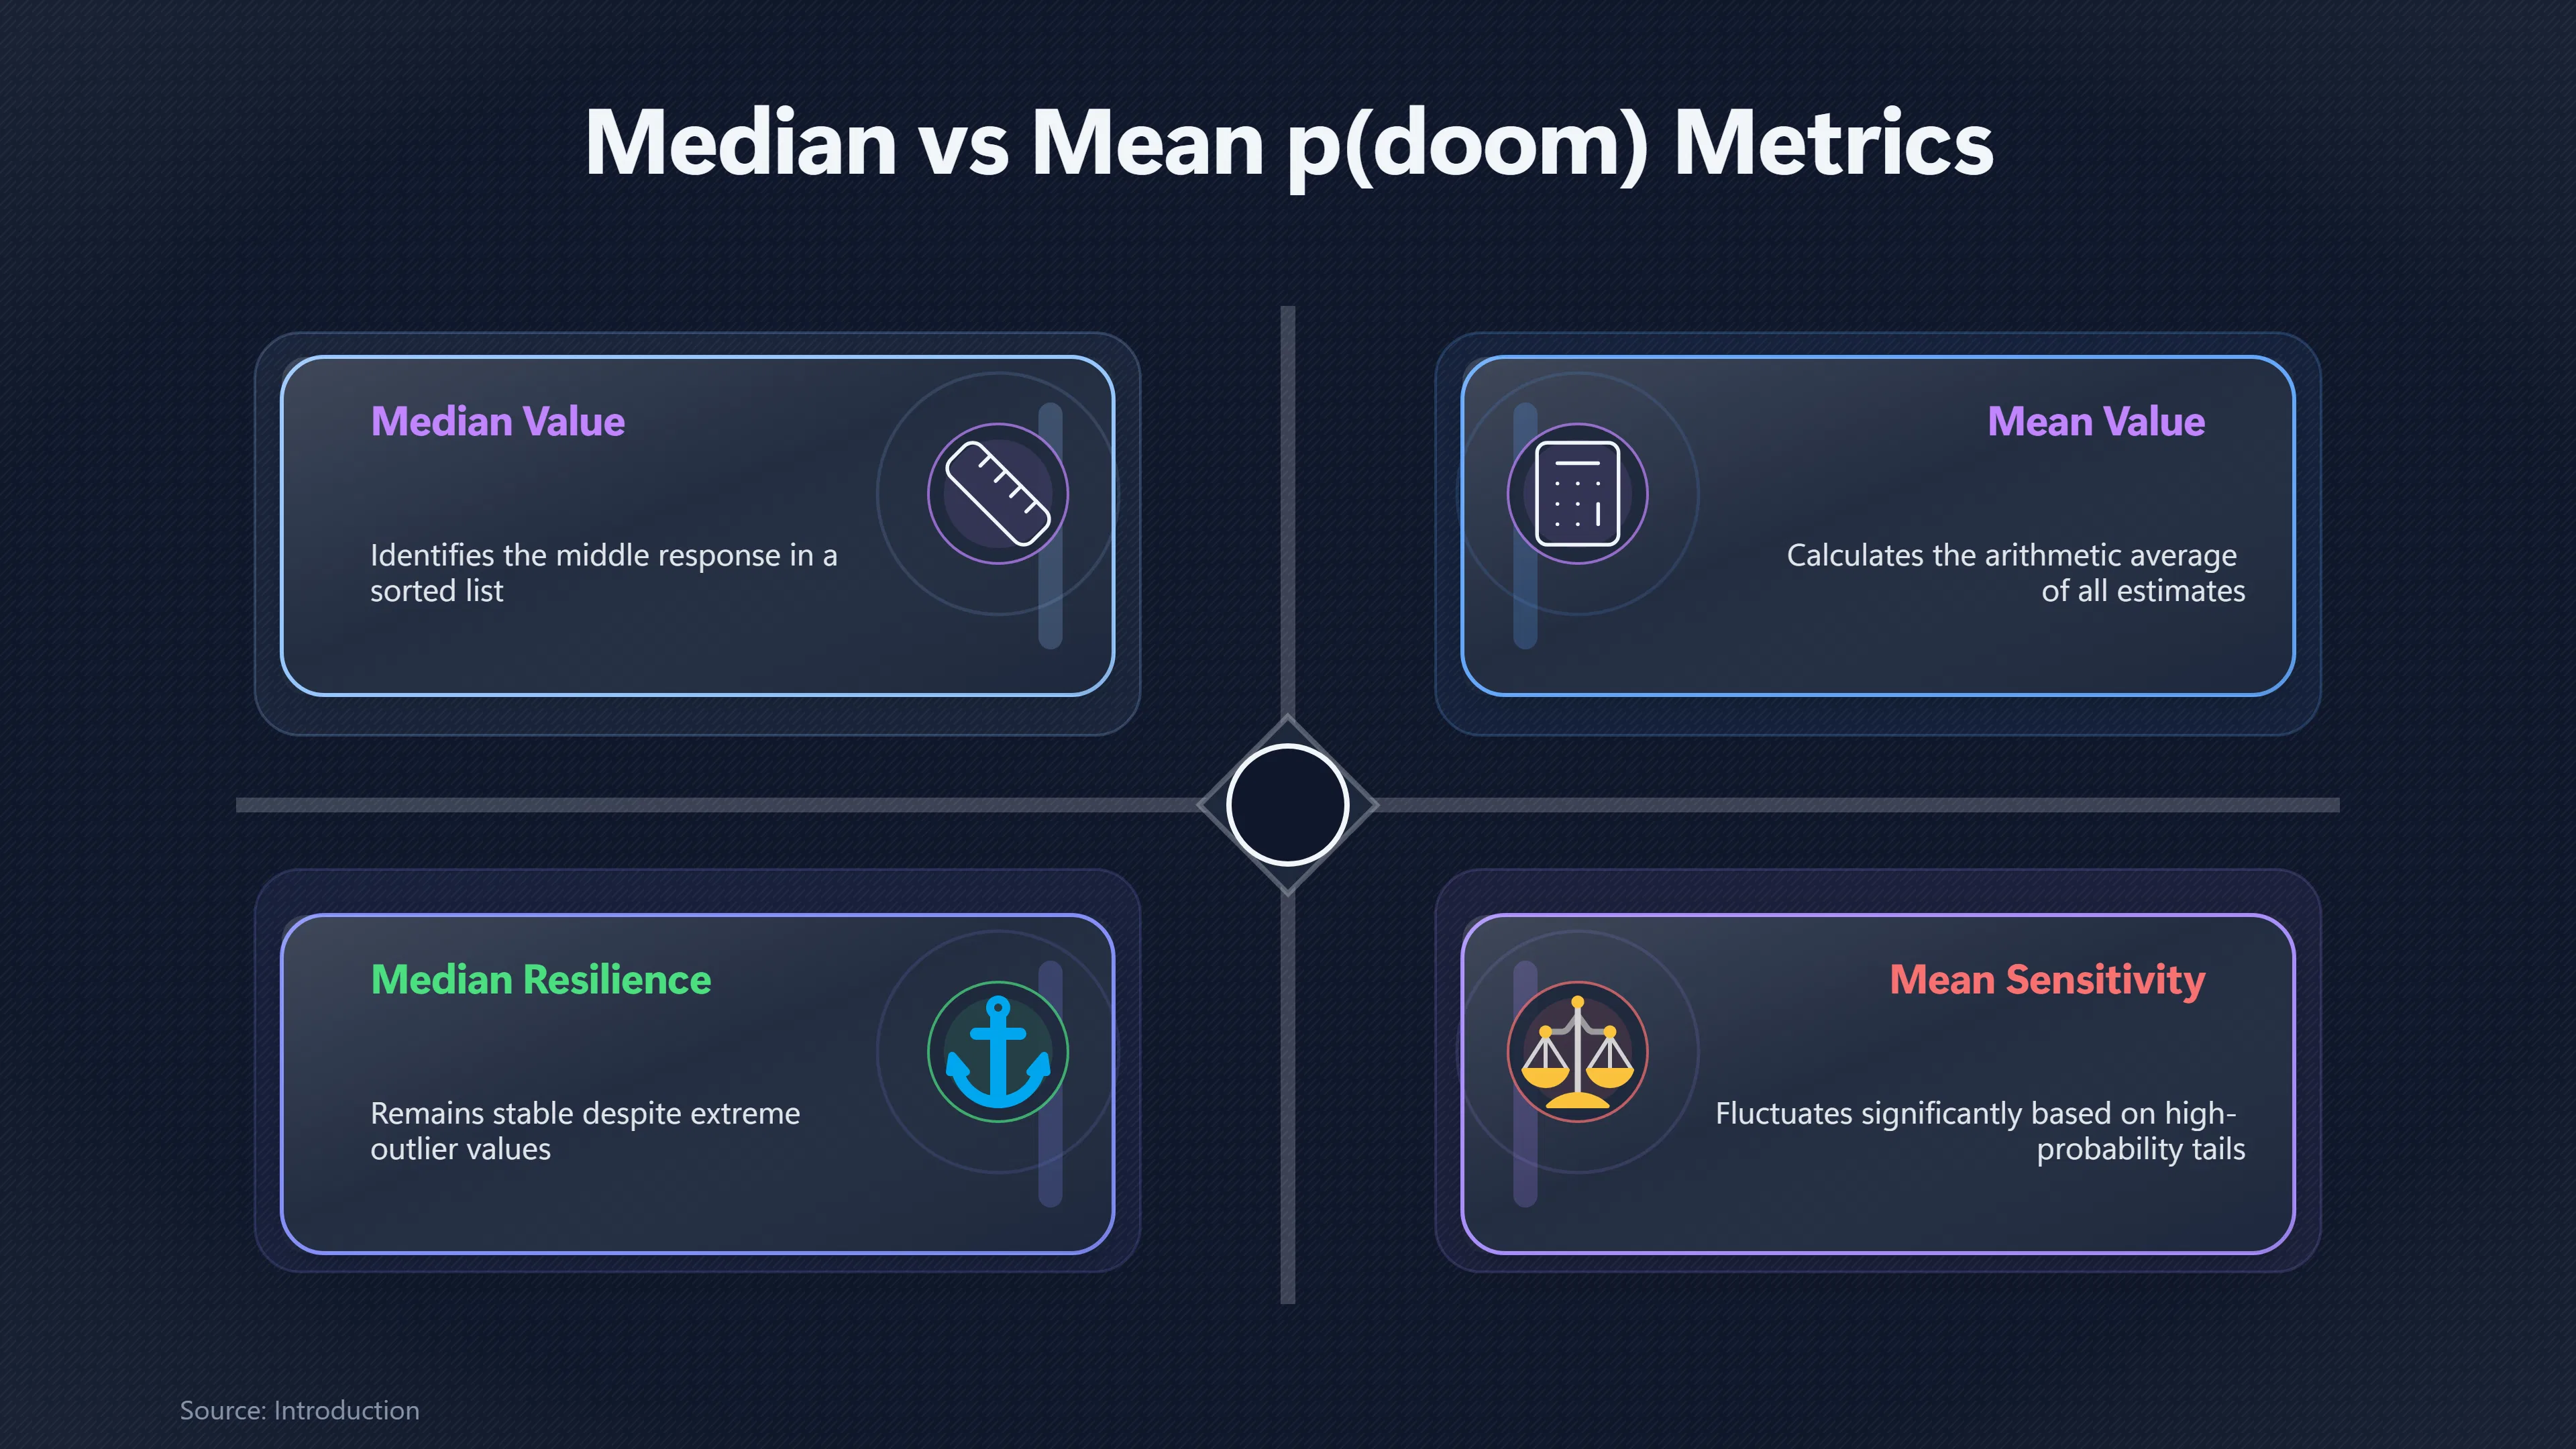
The median is the middle response once all estimates are arranged from lowest to highest. If the median p(doom) is 5%, it simply means that half of respondents gave estimates of 5% or less and half gave estimates above 5%.
That is a useful statistic because it is resistant to extreme values. If a handful of respondents estimate a 90% chance of existential catastrophe, they do not change the median unless enough similar responses move the middle of the distribution.
However, the median is often misunderstood.
A median of 5% does not mean:
- experts have collectively calculated a 5% risk;
- most experts think the risk is around 5%;
- disagreement is small.
Instead, it identifies only the midpoint. The responses on either side of that midpoint may be spread very widely.
This becomes particularly important in AI risk surveys because respondents often disagree not only about the probability of catastrophe but also about timelines, definitions of “doom”, the likelihood of successful alignment, the pace of AI progress and the effectiveness of future governance. Those disagreements naturally produce a broad distribution rather than a single consensus estimate.[AI Impacts]wiki.aiimpacts.org2023 expert survey on progress in aiAI Impacts2023 Expert Survey on Progress in AI [AI Impacts Wiki]August 17, 2023…
How high estimates pull up the mean
The mean is the arithmetic average of all responses. Every estimate contributes equally.
Unlike the median, the mean is sensitive to unusually high or unusually low values. If most respondents give estimates between 1% and 10%, but a noticeable minority report probabilities of 40%, 60% or 90%, those higher numbers raise the overall average substantially.
A simplified illustration shows why.
Respondentsp(doom) estimate50 people2%30 people5%15 people15%5 people80%
The median remains close to 5% because the middle respondent still falls in that group.
The mean, however, rises sharply because the five respondents assigning 80% probabilities contribute far more to the arithmetic average than the others.
This pattern—a concentration of relatively modest estimates combined with a long “upper tail” of much higher ones—is known as a right-skewed distribution. In such distributions, the mean naturally exceeds the median.
The 2023 Expert Survey on Progress in AI provides a real example. Depending on the wording of the question, respondents reported:
- median estimates of 5% or 10%;
- corresponding means of roughly 14% to 19%.
These are exactly the kinds of differences expected when a minority of participants place very large probabilities on catastrophic outcomes.[AI Impacts]aiimpacts.orgAI Impacts THOUSANDS OF AI AUTHORS ON THE FUTURE OF AIAI Impacts THOUSANDS OF AI AUTHORS ON THE FUTURE OF AI
The distribution matters more than either number
One reason the mean–median gap attracts attention is that it reveals something important about the underlying disagreement.
Imagine three possible survey results.
Scenario A
- Median: 5%
- Mean: 5%
Most respondents probably cluster around similar estimates.
Scenario B
- Median: 5%
- Mean: 16%
Many respondents remain near 5%, but some assign dramatically higher probabilities.
Scenario C
- Median: 16%
- Mean: 16%
The centre of opinion itself has shifted upwards.
Although all three situations produce familiar-looking numbers, they describe very different expert communities.
This is why researchers increasingly recommend looking beyond a single headline statistic. Histograms, cumulative distributions or percentile charts reveal whether disagreement is narrow, broad or concentrated in a small but influential minority.
Why p(doom) surveys naturally become skewed
Several features of AI risk forecasting make skewed distributions more likely than symmetrical ones.
First, respondents often share similar views about many technical issues while differing sharply on just one or two assumptions. A researcher who believes advanced AI arrives much later, or that alignment techniques improve rapidly, may assign a very low p(doom). Another researcher who agrees on almost everything else but expects rapid capability gains without corresponding safety progress may produce a much higher estimate.
Second, existential risks involve many uncertain links in a causal chain. Small differences in assumptions about any stage—capability growth, autonomy, control, governance or geopolitical competition—can compound into much larger differences in final probabilities.
Third, some researchers explicitly treat existential catastrophe as a low-probability but extremely consequential possibility. Such reasoning often generates estimates well above those produced by researchers who require much stronger evidence before assigning large probabilities to unprecedented events.
These mechanisms produce a distribution in which many estimates remain relatively modest while a smaller group occupies the high-probability tail.
Better ways to show disagreement and uncertainty
Because p(doom) estimates are so dispersed, many researchers argue that reporting only the mean or only the median hides important information.
More informative presentations include:
- Histograms, showing how responses are spread across different probability ranges.
- Percentiles, indicating where the lowest and highest estimates lie without allowing a few extreme values to dominate.
- Interquartile ranges, showing where the middle 50% of responses fall.
- Full response distributions, allowing readers to see whether opinions cluster tightly or divide into distinct camps.
The AI Impacts survey materials increasingly present distributions visually rather than relying solely on summary statistics. Those graphics make immediately visible that respondents occupy a wide range of positions rather than converging on a single shared estimate.[AI Impacts]aiimpacts.orgAI Impacts How bad a future do ML researchers expect? – AI ImpactsAI ImpactsHow bad a future do ML researchers expect? – AI ImpactsMarch 8, 2023…
What the mean–median gap tells readers
The gap between the mean and median should not be interpreted as evidence that either statistic is misleading.
Instead, each answers a different question.
- Median: What does the middle respondent believe?
- Mean: What is the average probability once every respondent’s estimate is counted equally?
When the mean is much higher than the median, the key takeaway is not that one number is “correct”. It is that expert opinion is unevenly distributed. A sizeable minority assigns substantially higher probabilities of existential catastrophe than the typical respondent, and those higher estimates materially affect the average.
For readers trying to understand the state of the debate over AI doom, that disagreement is often more informative than either headline number alone. Rather than revealing consensus, the difference between the mean and median highlights one of the defining features of current p(doom) research: experts agree that existential risk deserves serious consideration, but they remain deeply divided over how likely it actually is.
Amazon book picks
Further Reading
Books and field guides related to What the Average p(doom) Number Hides. Use these as the next step if you want deeper reading beyond the article.
Superforecasting
The international bestseller 'A manual for thinking clearly in an uncertain world. Read it.' Daniel Kahneman, author of Thinking, Fast an...
The Signal and the Noise
This work explores the history, art and science of prediction.
Thinking, Fast and Slow
Why is there more chance we'll believe something if it's in a bold type face? Why are judges more likely to deny parole before lunch? Why...
Naked Statistics
A New York Times bestseller "Brilliant, funny…the best math teacher you never had." —San Francisco Chronicle Once considered tedious, the...
eBay marketplace picks
Marketplace Samples
Live-tested eBay searches with available results related to this page.
Selected fromstatistics poster oneBay.co.uk.



Endnotes
1.
Source: wiki.aiimpacts.org
Title: 2023 expert survey on progress in ai
Link:https://wiki.aiimpacts.org/ai_timelines/predictions_of_human-level_ai_timelines/ai_timeline_surveys/2023_expert_survey_on_progress_in_ai
Source snippet
AI Impacts2023 Expert Survey on Progress in AI [AI Impacts Wiki]August 17, 2023...
Published: August 17, 2023
2.
Source: aiimpacts.org
Title: AI Impacts THOUSANDS OF AI AUTHORS ON THE FUTURE OF AI
Link:https://aiimpacts.org/wp-content/uploads/2023/04/Thousands_of_AI_authors_on_the_future_of_AI.pdf
3.
Source: aiimpacts.org
Title: AI Impacts How bad a future do ML researchers expect? – AI Impacts
Link:https://aiimpacts.org/how-bad-a-future-do-ml-researchers-expect/
Source snippet
AI ImpactsHow bad a future do ML researchers expect? – AI ImpactsMarch 8, 2023...
Published: March 8, 2023
4.
Source: aiimpacts.org
Title: AI Impacts How should we analyse survey forecasts of AI timelines? – AI Impacts
Link:https://aiimpacts.org/how-should-we-analyse-survey-forecasts-of-ai-timelines/
5.
Source: blog.aiimpacts.org
Link:https://blog.aiimpacts.org/p/faq-expert-survey-on-progress-in
Source snippet
No. Respondents answered nearly all the normal questions they saw (excluding demographics, free response, and conditionally-asked questio...
6.
Source: lesswrong.com
Title: ai impacts 2023 expert survey on progress in ai
Link:https://www.lesswrong.com/posts/RkegCmCgjGhskiFvm/ai-impacts-2023-expert-survey-on-progress-in-ai
Source snippet
Below are the medians and means of the 2704 responses: Overall impact of HLMI | Median response | Mean res...
7.
Source: lesswrong.com
Title: ai impacts survey december 2023 edition
Link:https://www.lesswrong.com/posts/NfPxAp5uwgZugwovY/ai-impacts-survey-december-2023-edition
Source snippet
Let’s zoom in, these are probabilities that someone responded with 10% or higher based on question wording: The p(doom) numbers here are...
Published: december 2023
8.
Source: theverysoon.com
Title: ai impacts survey december 2023 edition
Link:https://theverysoon.com/ai-impacts-survey-december-2023-edition/
Published: december 2023
9.
Source: wiki.aiimpacts.org
Title: ai risk surveys
Link:https://wiki.aiimpacts.org/uncategorized/ai_risk_surveys
10.
Source: blog.aiimpacts.org
Title: scoring forecasts from the 2016 expert survey on progress in ai
Link:https://blog.aiimpacts.org/p/scoring-forecasts-from-the-2016-expert-survey-on-progress-in-ai
11.
Source: aiimpacts.org
Title: 2022 expert survey on progress in ai
Link:https://aiimpacts.org/2022-expert-survey-on-progress-in-ai/
12.
Source: youtube.com
Title: AI Impacts Survey
Link:https://www.youtube.com/watch?v=xwJx_xqZI3Q
Source snippet
Katja Grace on the Largest Survey of [AI Researchers]({{ '2023-survey/' | relative_url }})...
13.
Source: youtube.com
Title: Katja Grace—Slowing Down AI, Forecasting AI Risk
Link:https://www.youtube.com/watch?v=rSw3UVDZge0
Source snippet
AI Impacts survey Katja Grace Will AI end everything? A guide to guessing | Katja Grace | EAG Bay Area 23 Effective Altruism...
Additional References
14.
Source: spectrum.ieee.org
Title: ai existential risk survey 2667013207
Link:https://spectrum.ieee.org/amp/ai-existential-risk-survey-2667013207
Source snippet
the Prophecies of AI Doom - IEEE SpectrumJanuary 25, 2024 — WEIGHING THE PROPHECIES OF AI DOOM Researchers surveyed point to AI’s existen...
Published: January 25, 2024
15.
Source: youtube.com
Title: Katja Grace on the Largest Survey of AI Researchers
Link:https://www.youtube.com/watch?v=qnqdTAO5OXw
Source snippet
Will AI end everything? A guide to guessing | Katja Grace | EAG Bay Area 23...
16.
Source: techmeme.com
Link:https://www.techmeme.com/240105/p19
17.
Source: youtube.com
Title: Will AI end everything? A guide to guessing | Katja Grace | EAG Bay Area 23
Link:https://www.youtube.com/watch?v=j5Lu01pEDWA
18.
Source: youtube.com
Link:https://www.youtube.com/watch?v=irc6spknltQ
Source snippet
Katja Grace—Slowing Down AI, Forecasting AI Risk...
19.
Source: youtu.be
Title: AI In Context
Link:https://youtu.be/_eYTkvZqbnQ