Within Mean vs Median
Can One p(doom) Number Hide Expert Disagreement?
Reporting only the mean or median can hide whether experts broadly agree or are split between low and very high estimates.
On this page
- How identical medians can conceal very different distributions
- When means exaggerate the apparent centre of opinion
- Which charts and percentiles give readers a fuller picture
Page outline Jump by section
Introduction
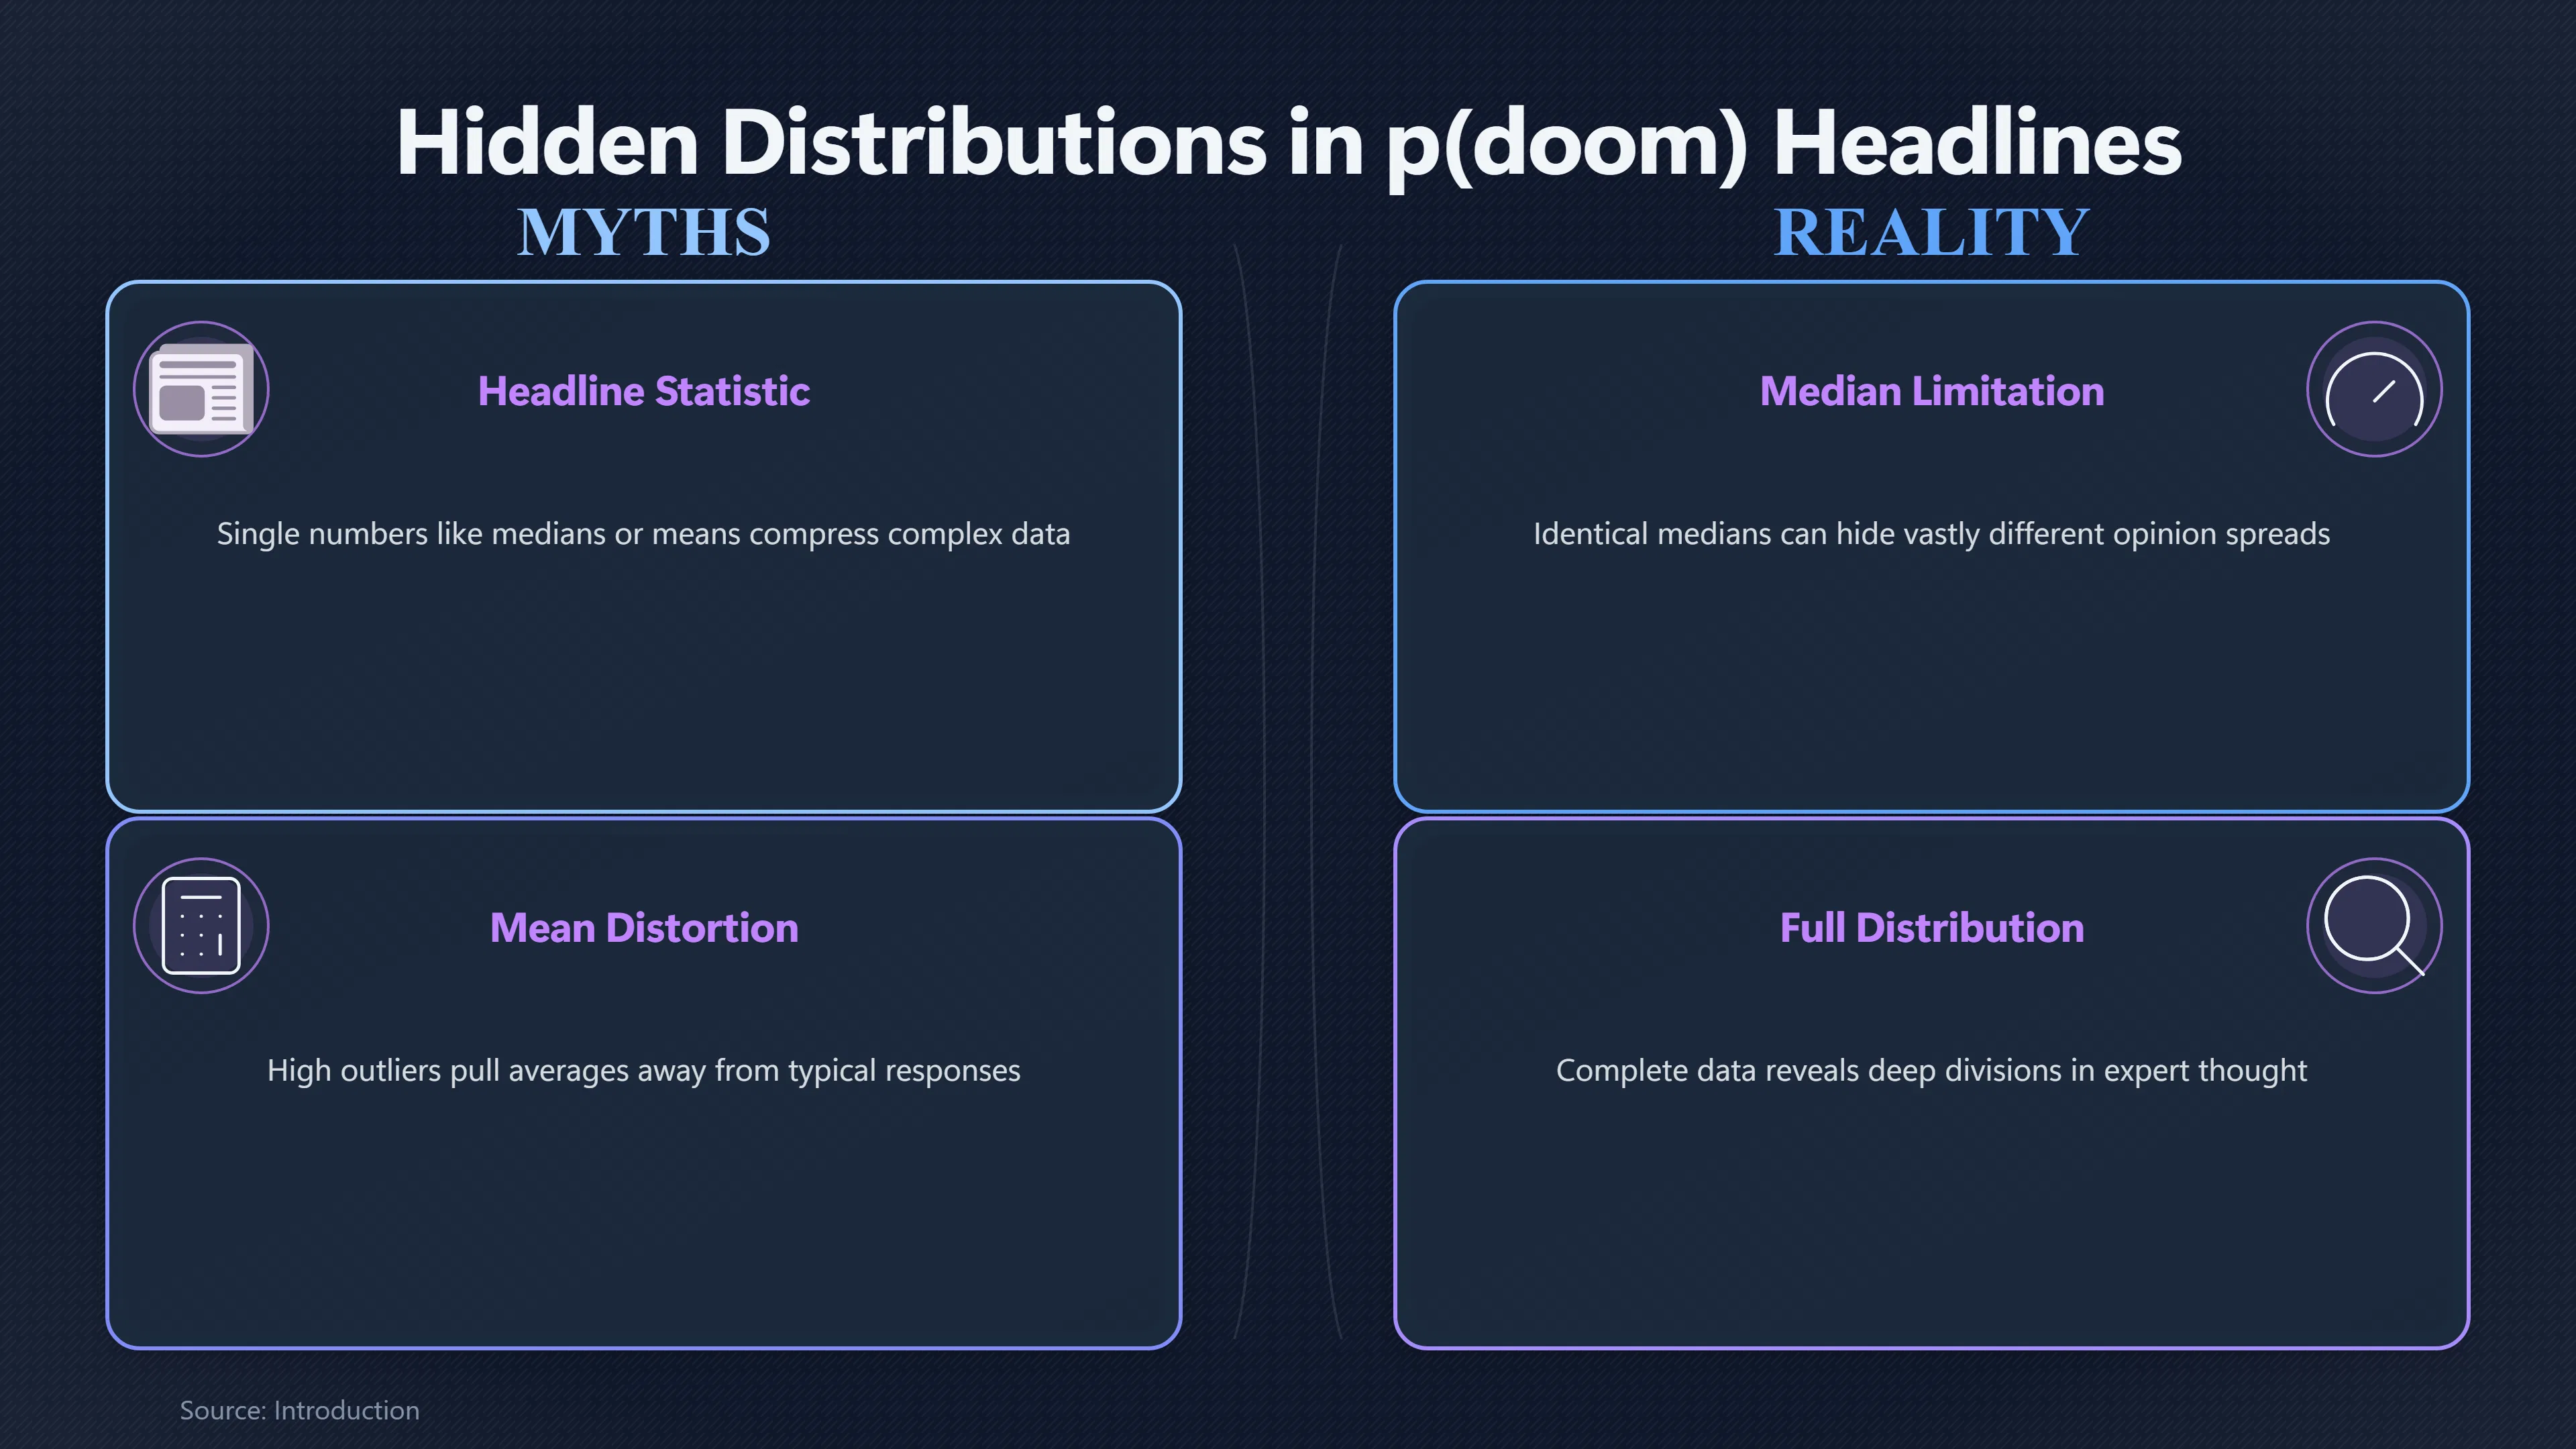
A single p(doom) headline can give a false impression that experts have reached a clear consensus about the probability of AI causing human extinction or another irreversible civilisational catastrophe. In reality, one summary number—whether it is a mean, a median or a percentage highlighted in a news story—compresses a much wider range of opinions into a simple figure. That matters because expert disagreement is itself an important part of understanding AI doom. A survey in which most respondents estimate a 1–5% risk but a sizeable minority estimate 50% or more tells a very different story from one where nearly everyone clusters around 5%, even if both produce a similar headline statistic. Understanding the shape of the distribution is often more informative than focusing on a single number alone.[AI Impacts]aiimpacts.orgAI Impacts How bad a future do ML researchers expect? – AI ImpactsAI ImpactsHow bad a future do ML researchers expect? – AI ImpactsMarch 8, 2023…
Why one headline number is often the wrong question
Readers naturally ask, “What do experts think the chance of AI doom is?” Journalists often answer by quoting a single figure, such as “the median estimate was 5%” or “experts put the average risk at 16%.”
Both statements can be accurate while still being incomplete.
A single statistic answers only one narrow question. It does not show:
- whether experts broadly agree or are sharply divided;
- whether disagreement comes from a handful of unusually high estimates or from several distinct schools of thought;
- how many respondents placed the risk near zero, in the single digits, or above 50%;
- how uncertain respondents felt about their own estimates.
This matters because p(doom) is not a measured physical quantity. It is a judgement about an uncertain future based on assumptions about AI capabilities, alignment, governance, human behaviour and technological progress. Experts who disagree about any of those assumptions can legitimately arrive at very different probabilities.[arXiv]arxiv.orgWhy do Experts Disagree on Existential Risk and P(doom)? A Survey of AI ExpertsJanuary 25, 2025…
How identical medians can conceal very different distributions
The median identifies only the middle response. It says nothing about how responses are spread around that midpoint.
Imagine two surveys with the same median of 5%.
Survey A
Most respondents estimate between 3% and 7%.
This suggests relatively broad agreement.
Survey B
Large groups estimate:
- below 1%;
- around 5%;
- between 40% and 80%.
The median is still 5%, but the expert community is clearly much more divided.
Those two situations have very different implications for anyone trying to understand the debate. In the first case, the disagreement is modest. In the second, the headline hides deep differences about whether advanced AI poses an existential threat at all.
This is why many statisticians recommend looking beyond measures of central tendency when distributions are uneven or heavily skewed. The AI Impacts surveys themselves make the full spread of responses available rather than relying solely on a single summary number.[AI Impacts]aiimpacts.orgAI Impacts How bad a future do ML researchers expect? – AI ImpactsAI ImpactsHow bad a future do ML researchers expect? – AI ImpactsMarch 8, 2023…
When means exaggerate the apparent centre of opinion
The arithmetic mean has the opposite limitation.
Because every response contributes equally, relatively few very high estimates can pull the average upwards even if most respondents gave much lower probabilities.
For example:
- 80 researchers estimate 2%.
- 15 estimate 20%.
- 5 estimate 80%.
The mean becomes much higher than the estimate given by most respondents.
That does not mean the average respondent believes there is a high probability of AI doom. It means the arithmetic average reflects the influence of a minority assigning extremely high probabilities.
This pattern appears in several expert surveys of AI researchers. Reported means for existential-risk questions are noticeably higher than reported medians because the distribution has a long upper tail rather than being evenly clustered around one value.[arXiv]arxiv.orgarXiv Thousands of AI Authors on the Future of AIarXiv Thousands of AI Authors on the Future of AI
The opposite can also happen in principle. If a survey contained a small group assigning near-zero probabilities while most respondents clustered at higher values, the mean could fall below the median. The important lesson is that the mean reflects the entire distribution, not the “typical” respondent.
The distribution tells a richer story than either summary
A better way to understand expert opinion is to ask several questions together rather than relying on one statistic.
For example:
- What is the median?[wiki.aiimpacts.org]wiki.aiimpacts.org2022 expert survey on progress in ai2022 expert survey on progress in ai * What is the mean?[wiki.aiimpacts.org]wiki.aiimpacts.org2022 expert survey on progress in ai2022 expert survey on progress in ai
- What percentage assigns less than 1%?
- What percentage assigns at least 10%?
- How many estimate 50% or higher?
- How widely are responses spread?
Taken together, these questions reveal whether disagreement is mild or profound.
The 2023 Expert Survey on Progress in AI illustrates this point. While headline attention often focused on the median estimate of around 5% for questions involving human extinction or similarly severe outcomes, the published results also showed substantially higher means and a sizeable proportion of respondents assigning at least a 10% probability. Those facts are not contradictory; they describe different features of the same distribution.[arXiv]arxiv.orgarXiv Thousands of AI Authors on the Future of AIarXiv Thousands of AI Authors on the Future of AI
Why headlines often oversimplify
News reporting naturally favours concise numbers.
A headline saying:
“Experts estimate a 5% chance of AI extinction”
is shorter than explaining the entire distribution of responses.
However, readers can easily infer more certainty than the evidence supports.
Common misunderstandings include assuming that:
- experts largely agree on one probability;
- the quoted figure represents an objective scientific calculation;
- respondents used identical assumptions about AI development;
- anyone giving substantially higher or lower estimates is an outlier.
In practice, AI researchers disagree about timelines, the likelihood of successful alignment, the feasibility of maintaining human control, the pace of capability advances, geopolitical competition and future governance. Those disagreements naturally generate a broad spread of p(doom) estimates rather than a single consensus value.[arXiv]arxiv.orgWhy do Experts Disagree on Existential Risk and P(doom)? A Survey of AI ExpertsJanuary 25, 2025…
Which charts give readers a fuller picture?
When surveys publish only one headline statistic, important information disappears.
Several simple visualisations communicate disagreement much more effectively:
- Histograms, showing how many respondents selected different probability ranges.
- Percentile plots, revealing where the middle 50% or 90% of estimates lie.
- Box plots, highlighting the median alongside the spread and unusually high or low responses.
- Cumulative distribution charts, showing the proportion of experts assigning at least a given probability.
These charts allow readers to distinguish between genuine consensus and a population split between optimistic and pessimistic camps.
The AI Impacts team has published full distributions for some survey questions precisely because the underlying pattern of responses is more informative than a single headline number.[AI Impacts]aiimpacts.orgAI Impacts How bad a future do ML researchers expect? – AI ImpactsAI ImpactsHow bad a future do ML researchers expect? – AI ImpactsMarch 8, 2023…
The real takeaway is about disagreement, not precision
The biggest mistake is treating one p(doom) number as though it were a settled scientific measurement.
Expert surveys measure informed judgement under profound uncertainty, not experimentally verified probabilities. A reported median or mean is useful because it summarises one aspect of those judgements, but neither captures the full picture.
For readers trying to understand debates about AI doom, the most revealing question is often not “What is the number?” but “How much do qualified people disagree, and why?”
Looking at the full distribution of estimates, rather than a single headline figure, makes that disagreement visible and provides a more faithful picture of the current state of expert opinion.[arXiv]arxiv.orgarXiv Thousands of AI Authors on the Future of AIarXiv Thousands of AI Authors on the Future of AI
Amazon book picks
Further Reading
Books and field guides related to Can One p(doom) Number Hide Expert Disagreement?. Use these as the next step if you want deeper reading beyond the article.
The Alignment Problem
Finalist for the Los Angeles Times Book Prize A jaw-dropping exploration of everything that goes wrong when we build AI systems and the m...
Superforecasting
The international bestseller 'A manual for thinking clearly in an uncertain world. Read it.' Daniel Kahneman, author of Thinking, Fast an...
The Signal and the Noise
This work explores the history, art and science of prediction.
Thinking, Fast and Slow
Why is there more chance we'll believe something if it's in a bold type face? Why are judges more likely to deny parole before lunch? Why...
eBay marketplace picks
Marketplace Samples
Live-tested eBay searches with available results related to this page.
Selected fromstatistics wall art oneBay.co.uk.


Endnotes
1.
Source: arxiv.org
Title: arXiv Thousands of AI Authors on the Future of AI
Link:https://arxiv.org/abs/2401.02843
2.
Source: arxiv.org
Link:https://arxiv.org/abs/2502.14870
Source snippet
Why do Experts Disagree on Existential Risk and P(doom)? A Survey of AI ExpertsJanuary 25, 2025...
Published: January 25, 2025
3.
Source: youtube.com
Link:https://www.youtube.com/watch?v=hliLDNdxkX0
Source snippet
AI Impacts Survey - The key implications, with Katja Grace...
4.
Source: youtube.com
Title: AI Impacts Survey
Link:https://www.youtube.com/watch?v=xwJx_xqZI3Q
Source snippet
Will AI end everything? A guide to guessing | Katja Grace | EAG Bay Area 23...
5.
Source: youtube.com
Link:https://www.youtube.com/watch?v=xW0xjAMD60c
Source snippet
AI Impacts survey Katja Grace [p doom]({{ 'p-doom/' | relative_url }}) 313 - Guest: Katja Grace, AI Impact Researcher, part 1 Human Cusp...
6.
Source: aiimpacts.org
Title: AI Impacts How bad a future do ML researchers expect? – AI Impacts
Link:https://aiimpacts.org/how-bad-a-future-do-ml-researchers-expect/
Source snippet
AI ImpactsHow bad a future do ML researchers expect? – AI ImpactsMarch 8, 2023...
Published: March 8, 2023
7.
Source: wiki.aiimpacts.org
Title: AI Impacts Surveys of experts on levels of AI Risk [AI Impacts Wiki]
Link:https://wiki.aiimpacts.org/uncategorized/ai_risk_surveys
8.
Source: blog.aiimpacts.org
Title: AI Impacts Blog FAQ: Expert Survey on Progress in AI methodology
Link:https://blog.aiimpacts.org/p/faq-expert-survey-on-progress-in
Source snippet
Respondents are allocated randomly to one place in each horizontal set of blocks. DID ONLY A HANDFUL OF PEOPLE ANSWER EXTINCTION-REL...
9.
Source: lesswrong.com
Title: ai impacts survey december 2023 edition
Link:https://www.lesswrong.com/posts/NfPxAp5uwgZugwovY/ai-impacts-survey-december-2023-edition
Published: december 2023
10.
Source: theverysoon.com
Title: ai impacts survey december 2023 edition
Link:https://theverysoon.com/ai-impacts-survey-december-2023-edition/
Published: december 2023
11.
Source: blog.aiimpacts.org
Title: 2023 [ai survey]({{ ‘survey-bias/’ | relative_url }}) of 2778 six things
Link:https://blog.aiimpacts.org/p/2023-ai-survey-of-2778-six-things?action=share
12.
Source: wiki.aiimpacts.org
Title: 2022 expert survey on progress in ai
Link:https://wiki.aiimpacts.org/ai_timelines/predictions_of_human-level_ai_timelines/ai_timeline_surveys/2022_expert_survey_on_progress_in_ai
13.
Source: aiimpacts.org
Title: 2022 expert survey on progress in ai
Link:https://aiimpacts.org/2022-expert-survey-on-progress-in-ai/
14.
Source: aiimpacts.org
Link:https://aiimpacts.org/how-should-we-analyse-survey-forecasts-of-ai-timelines/
Additional References
15.
Source: researchgate.net
Title: (PDF) Why do Experts Disagree on Existential Risk and P(doom)?
Link:https://www.researchgate.net/publication/389274220_Why_do_Experts_Disagree_on_Existential_Risk_and_Pdoom_A_Survey_of_AI_Experts
Source snippet
A Survey of AI ExpertsJanuary 25, 2025 — from building AGI. For example, Dr. Roman Yampolskiy estimates a 99% chance of an AI-caused exis...
Published: January 25, 2025
16.
Source: bayes.net
Title: How should we analyse survey forecasts of AI timelines?
Link:https://bayes.net/espai/
Source snippet
16, 2024 — I provide recommendations for how the survey results should be analysed and presented in the future. HEADL...
Published: December 16, 2024
17.
Source: researchgate.net
Title: 396256646 Thousands of AI Authors on the Future of AI
Link:https://www.researchgate.net/publication/396256646_Thousands_of_AI_Authors_on_the_Future_of_AI
Source snippet
The chance of all occupations becoming fully automatable, however, was not expected to reach 10% until 2037, and 50% until 2116 (compared...
18.
Source: youtube.com
Title: Is p(doom) bullsh*t?
Link:https://www.youtube.com/watch?v=gyOGhnEnGkk
Source snippet
P(doom): Probability that AI will destroy human civilization | Roman Yampolskiy and Lex Fridman...
19.
Source: abc.net.au
Link:https://www.abc.net.au/news/2023-07-15/whats-your-pdoom-ai-researchers-worry-catastrophe/102591340
20.
Source: meaningintheageofai.com
Link:https://meaningintheageofai.com/the-four-futures-of-ai
21.
Source: sfu.ca
Link:https://www.sfu.ca/~smith/pdoom_interactive_standalone.html
22.
Source: youtube.com
Title: Will AI end everything? A guide to guessing | Katja Grace | EAG Bay Area 23
Link:https://www.youtube.com/watch?v=j5Lu01pEDWA
Source snippet
Is p(doom) bullsh*t?...
23.
Source: paperswithcode.com
Title: Thousands of AI Authors on the Future of AI | Papers With Code
Link:https://paperswithcode.com/paper/thousands-of-ai-authors-on-the-future-of-ai
24.
Source: studylib.net
Title: A I Researchers Survey: Progress, Risks, and Timelines
Link:https://studylib.net/doc/28248523/thousands-of-ai-authors-on-the-future-of-ai