Within Mean vs Median
Why a Few High Estimates Change the Mean
A small group of very high p(doom) estimates can raise the mean sharply even when the median remains low.
On this page
- How extreme estimates affect an arithmetic average
- A worked example of a right skewed p(doom) survey
- What the mean reveals that the median does not
Page outline Jump by section
Introduction
When surveys ask AI researchers or forecasters for their p(doom)—their estimated probability that advanced AI could ultimately cause human extinction or another irreversible civilisational catastrophe—the arithmetic mean can end up much higher than the median. This is not necessarily because most respondents are highly pessimistic. Instead, it often reflects a statistical feature of the responses: a relatively small group assigns very high probabilities, and those values exert a disproportionate influence on the average. In AI risk surveys, this creates a right-skewed distribution, where the upper tail of unusually large estimates pulls the mean upwards while leaving the median largely unchanged. Understanding this mechanism helps explain why surveys can report, for example, a median near 5% alongside a mean in the mid-teens without any contradiction.[arXiv]arxiv.orgThousands of AI Authors on the Future of AIJanuary 5, 2024…
Why the arithmetic mean responds to high estimates
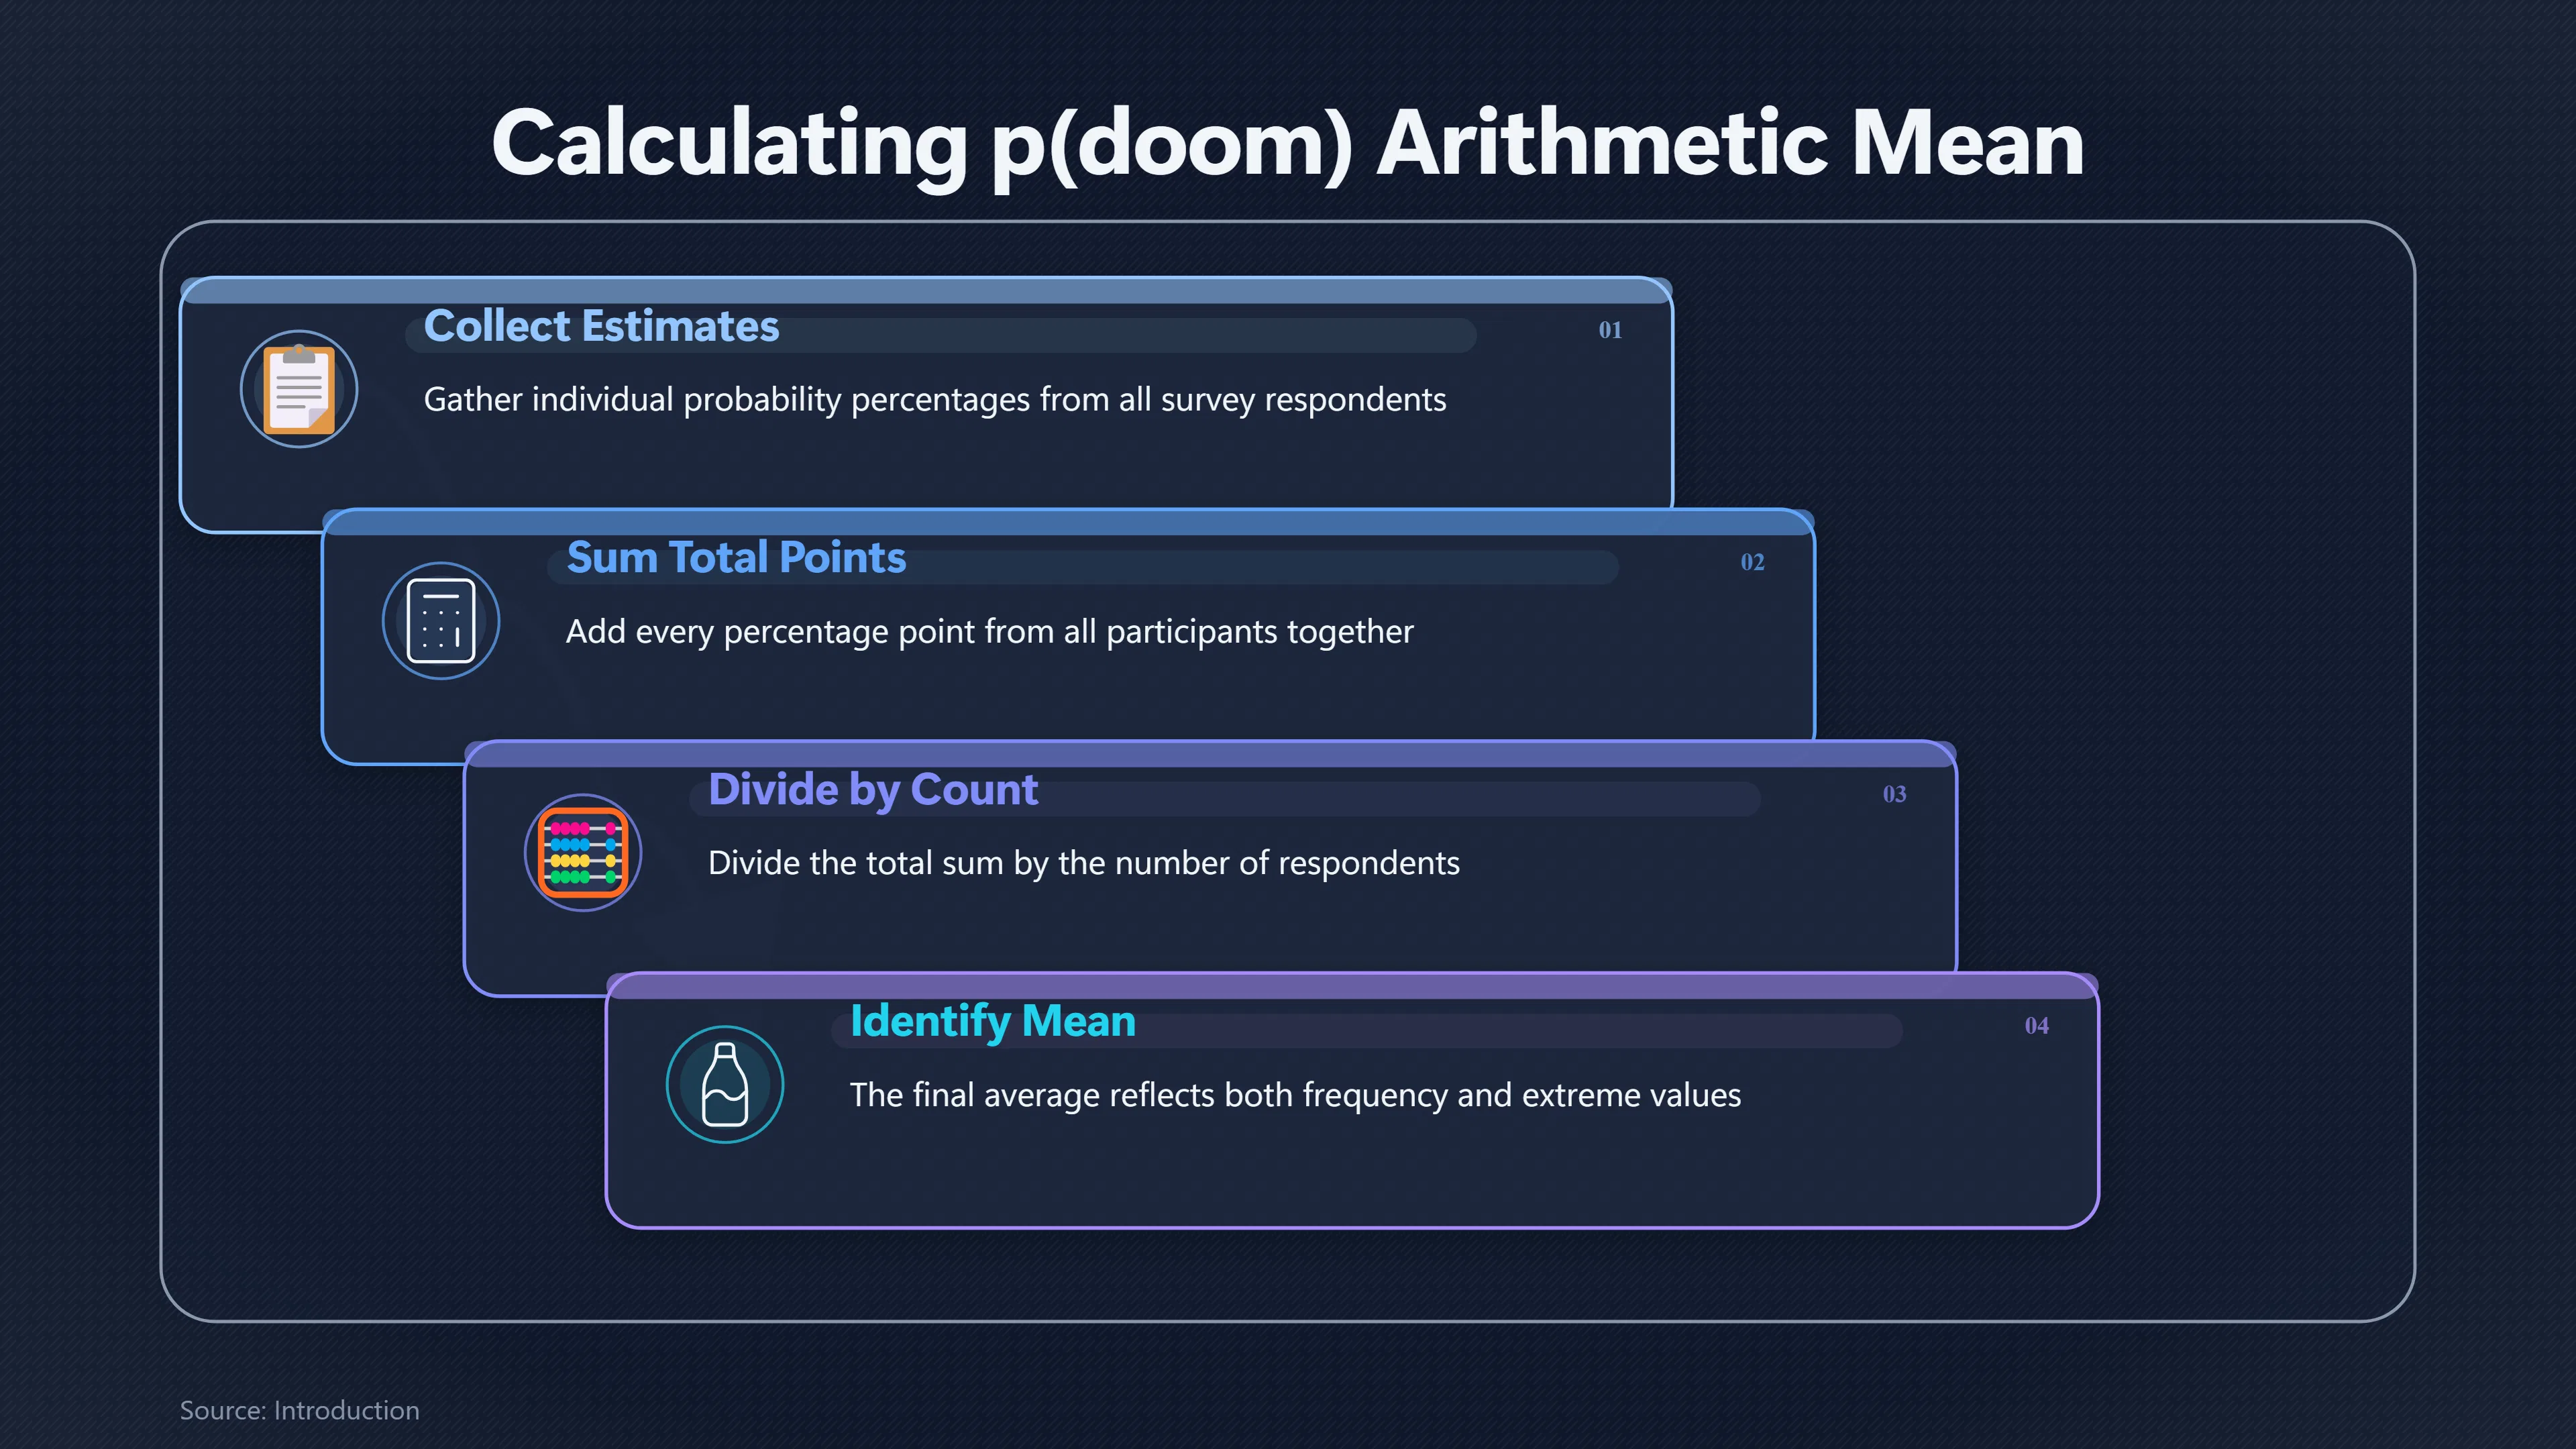
The arithmetic mean is calculated by adding every respondent’s estimate and dividing by the total number of responses. Every percentage point contributes equally to the total.
That means a respondent assigning a p(doom) of 80% contributes sixteen times as much to the final average as someone assigning 5%. The mean therefore reflects both how many people hold high-risk views and how extreme those views are.
The median works differently. It depends only on the ordering of responses. Once all estimates are arranged from lowest to highest, the median is simply the middle value. Whether the largest estimate is 30%, 80% or 99%, it affects the median only if enough similarly high estimates move the midpoint of the distribution.
This is a general statistical property rather than something unique to AI forecasting. In right-skewed distributions, the mean is typically greater than the median because the long upper tail pulls the arithmetic average upwards.[OpenStax]openstax.orgOpen Stax2.6 Skewness and the Mean, Median, and ModeOpenStax2.6 Skewness and the Mean, Median, and Mode - Introductory Statistics 2e | OpenStax
A worked example of a right-skewed p(doom) survey
Imagine a survey of 100 respondents with the following estimates:
GroupNumber of respondentsp(doom) estimateLow estimates502%Moderate estimates305%Higher estimates1515%Very high estimates580%
The median remains around 5% because the 50th and 51st respondents fall within the large cluster of relatively modest estimates.
The mean, however, is much higher:
- 50 × 2% = 100 percentage points
- 30 × 5% = 150
- 15 × 15% = 225
- 5 × 80% = 400
The total is 875 percentage points across 100 respondents, giving a mean of 8.75%.
Notice what happened. Only five respondents assigned an 80% probability, yet together they contributed almost half of the entire sum used to calculate the average. They did not change the middle respondent, but they substantially increased the arithmetic mean.
This illustrates why discussions of p(doom) surveys often focus on the upper tail of the distribution rather than simply quoting a single headline average.
The high-end tail in real AI surveys
This pattern appears in real expert surveys rather than only in hypothetical examples.
The 2023 Expert Survey on Progress in AI, conducted among thousands of researchers who had published at leading AI conferences, found a wide spread of expectations about extremely bad outcomes. Many respondents gave relatively modest probabilities, while a sizeable minority assigned substantially higher ones. As a result, reported means for catastrophic outcomes were noticeably higher than the corresponding medians.[arXiv]arxiv.orgThousands of AI Authors on the Future of AIJanuary 5, 2024…
The survey also found that large fractions of respondents assigned non-trivial probabilities to extremely bad outcomes. For example, between roughly 38% and 51% of respondents gave at least a 10% chance of outcomes as bad as human extinction, depending on the wording of the question. That does not imply agreement on precise numbers, but it does demonstrate a broad distribution extending well into higher estimates.[arXiv]arxiv.orgThousands of AI Authors on the Future of AIJanuary 5, 2024…
The key point is not that a handful of extreme values completely dominate the data. Rather, the upper tail consists of enough respondents with substantially higher estimates that the arithmetic average rises well above the midpoint.
What the mean reveals that the median does not
A higher mean than median provides information that the median alone cannot.
Specifically, it suggests that the distribution is asymmetric. In the context of p(doom), this means there is a meaningful minority assigning much higher probabilities than the typical respondent.
That can be informative because it highlights the extent of disagreement within the expert community. Two surveys could both report a median of 5%, yet differ greatly:
- One could have nearly everyone clustered between 3% and 7%.
- Another could have many estimates near 5% alongside a noticeable minority giving estimates of 40%, 60% or higher.
The medians would look identical, but the second survey would produce a much higher mean and indicate far greater diversity of judgement.
The mean therefore captures something about the weight of high-risk opinion, while the median captures the middle position. Neither statistic alone describes the full distribution.[OpenStax]openstax.orgOpen Stax2.6 Skewness and the Mean, Median, and ModeOpenStax2.6 Skewness and the Mean, Median, and Mode - Introductory Statistics 2e | OpenStax
Why a higher mean should not be over-interpreted
Although the mean is useful, it should not be treated as evidence that the average respondent literally believes the quoted probability.
Several factors caution against over-interpreting the number:
- Large uncertainty. Respondents often express substantial uncertainty about AI progress, alignment, governance and definitions of catastrophic outcomes, so p(doom) estimates are subjective judgements rather than measurements.
- Different reasoning. High estimates may arise from very different arguments, such as concerns about loss of control, deceptive alignment, geopolitical competition or failures of coordination.
- Different definitions. Surveys sometimes ask about extinction specifically, while others include broader permanent civilisational catastrophes. Different wording changes the distribution.
For these reasons, a high mean should be read as evidence that a significant minority assign very large probabilities—not as proof that experts have collectively settled on that figure as the best estimate.[arXiv]arxiv.orgThousands of AI Authors on the Future of AIJanuary 5, 2024…
Reading the mean and median together
The gap between the mean and median is itself informative.
A relatively small gap suggests that respondents are clustered around similar estimates. A larger gap indicates a longer upper tail of pessimistic forecasts and therefore greater disagreement about existential risk.
For readers trying to understand expert opinion on AI doom, the most informative approach is not to ask whether the mean or median is “correct”. Instead, read them together:
- The median identifies the middle of expert opinion.
- The mean shows how much influence higher-end estimates have on the overall distribution.
- The gap between them signals whether opinions are tightly clustered or spread across a wide range.
Seen in this way, a higher mean is not a statistical curiosity. It is evidence that discussions of AI existential risk include a substantial minority who judge the probability of catastrophe to be much higher than the typical respondent, even though they do not represent the median view.

Amazon book picks
Further Reading
Books and field guides related to Why a Few High Estimates Change the Mean. Use these as the next step if you want deeper reading beyond the article.
The Alignment Problem
Finalist for the Los Angeles Times Book Prize A jaw-dropping exploration of everything that goes wrong when we build AI systems and the m...
Superforecasting
The international bestseller 'A manual for thinking clearly in an uncertain world. Read it.' Daniel Kahneman, author of Thinking, Fast an...
The Book of Why
The hugely influential book on how the understanding of causality revolutionized science and the world, by the pioneer of artificial inte...
How to Measure Anything
Now updated with new research and even more intuitive explanations, a demystifying explanation of how managers can inform themselves to m...
eBay marketplace picks
Marketplace Samples
Live-tested eBay searches with available results related to this page.
Selected fromprobability wall art oneBay.co.uk.



Endnotes
1.
Source: arxiv.org
Link:https://arxiv.org/abs/2401.02843
Source snippet
Thousands of AI Authors on the Future of AIJanuary 5, 2024...
Published: January 5, 2024
2.
Source: openstax.org
Title: Open Stax2.6 Skewness and the Mean, Median, and Mode
Link:https://openstax.org/books/introductory-statistics-2e/pages/2-6-skewness-and-the-[mean-median
Source snippet
2.6 Skewness and the Mean, Median, and Mode - Introductory Statistics 2e | OpenStax...
3.
Source: openstax.org
Title: Open Stax2.6 Skewness and the Mean, Median, and Mode
Link:https://openstax.org/books/statistics/pages/2-6-skewness-and-the-mean-median-and-mode
Source snippet
2.6 Skewness and the Mean, Median, and Mode - Statistics | OpenStax...
4.
Source: openstax.org
Title: 2.6 Skewness and the Mean, Median, and Mode
Link:https://openstax.org/books/introductory-business-statistics-2e/pages/2-6-skewness-and-the-mean-median-and-mode
5.
Source: openstax.org
Title: 2.6 Skewness and the Mean, Median, and Mode
Link:https://openstax.org/books/introductory-business-statistics/pages/2-6-skewness-and-the-mean-median-and-mode?query=empirical+rule
6.
Source: wiki.aiimpacts.org
Title: 2023 expert survey on progress in ai
Link:https://wiki.aiimpacts.org/ai_timelines/predictions_of_human-level_ai_timelines/ai_timeline_surveys/2023_expert_survey_on_progress_in_ai
7.
Source: wiki.aiimpacts.org
Title: ai risk surveys
Link:https://wiki.aiimpacts.org/uncategorized/ai_risk_surveys
Additional References
8.
Source: codebegun.com
Title: Mean Median Mode: When to Use Each Average | Code Begun
Link:https://www.codebegun.com/learn/data-analytics/statistics/mean-median-mode
Source snippet
Mean Median Mode: When to Use Each Average | CodeBegunJuly 16, 2026 — Updated: 16 July 2026 MEAN, MEDIAN AND MODE EXPLAINED Image: Siva P...
Published: July 16, 2026
9.
Source: researchgate.net
Title: 396256646 Thousands of AI Authors on the Future of AI
Link:https://www.researchgate.net/publication/396256646_Thousands_of_AI_Authors_on_the_Future_of_AI
Source snippet
The chance of all occupations becoming fully automatable, however, was not expected to reach 10% until 2037, and 50% until 2116 (compared...
10.
Source: statistics.arabpsychology.com
Title: interpret data where mean is greater than median
Link:https://statistics.arabpsychology.com/interpret-data-where-mean-is-greater-than-median/
Source snippet
Right Skewness: How The Mean And Median Reveal Data Distribution - PSYCHOLOGICAL STATISTICSNovember 10, 2025 — UNDERSTANDING RIGHT SKEWNE...
Published: November 10, 2025
11.
Source: stats.libretexts.org
Title: org2.7: Skewness and the Mean, Median, and Mode
Link:https://stats.libretexts.org/Bookshelves/Introductory_Statistics/Introductory_Statistics_2e_%28OpenStax%29/02%3A_Descriptive_Statistics/2.07%3A_Skewness_and_the_Mean_Median_and_Mode
Source snippet
Last updated 2. Save as PDF * Page ID 40720 * Image: OpenStax * OpenStax * OpenStax \(\newcommand{\vecs}[1]{\overset { \scriptstyle \rig...
12.
Source: blog.aiimpacts.org
Link:https://blog.aiimpacts.org/p/faq-expert-survey-on-progress-in
Source snippet
No. Respondents answered nearly all the normal questions they saw (excluding demographics, free response, and conditionally-asked questio...
13.
Source: geeksforgeeks.org
Title: Right Skewed Histogram
Link:https://www.geeksforgeeks.org/maths/right-skewed-histogram/
Source snippet
July 23, 2025 — RIGHT SKEWED HISTOGRAM Last Updated: 23 Jul, 2025 * * * Right-skewed histogram is a graph showing the distr...
Published: July 23, 2025
14.
Source: youtube.com
Link:https://www.youtube.com/watch?v=hliLDNdxkX0
Source snippet
AI Impacts Survey - The key implications, with Katja Grace...
15.
Source: youtube.com
Title: AI Impacts Survey
Link:https://www.youtube.com/watch?v=xwJx_xqZI3Q
Source snippet
Will AI end everything? A guide to guessing | Katja Grace | EAG Bay Area 23...
16.
Source: treese41528.github.io
Link:https://treese41528.github.io/STAT350/Website/chapter2/lectures/2-4-exploring-quantitative-distributions-modality-shape-and-outliers.html
17.
Source: aiimpacts.org
Link:https://aiimpacts.org/how-should-we-analyse-survey-forecasts-of-ai-timelines/